Those of you who have been following us for a while will notice that this year’s Shorebird Data looks a little different than usual. For the past several years, we’ve asked volunteers to follow the International Shorebird Survey (ISS) protocol, which involves travelling along pre-determined routes at four target IBA’s to look for shorebirds. This method has been challenging for us, mostly due to the large fluctuations in water levels from year to year. Sometimes the routes become inaccessible due to high water; sometimes the areas of suitable shorebird habitat have dried up. An area with high quality shorebird habitat one year might look completely different the next year, and the ISS protocol doesn’t take that kind of variability into account.
So, this year we decided to take a different approach, asking volunteers to share shorebird observations with us outside the constraints of the ISS routes, and even outside of IBA boundaries. This data will help us determine where the important shorebird areas are in the province, and will be used to help us figure out our next steps for shorebird surveys.
With that preamble over, let’s get to the data! I’ve still split the data into two seasons, spring (April 1 – June 15, 2025) and fall (July 11 – October 25, 2025), and we’ll look at the same four IBA’s as in previous years: Whitewater Lake, Shoal Lakes, Oak Lake/Plum Lakes and Oak Hammock Marsh. At the end of the post, I’ll include a short discussion of the other areas that had high numbers of shorebirds outside of those four IBA’s.
Whitewater Lake
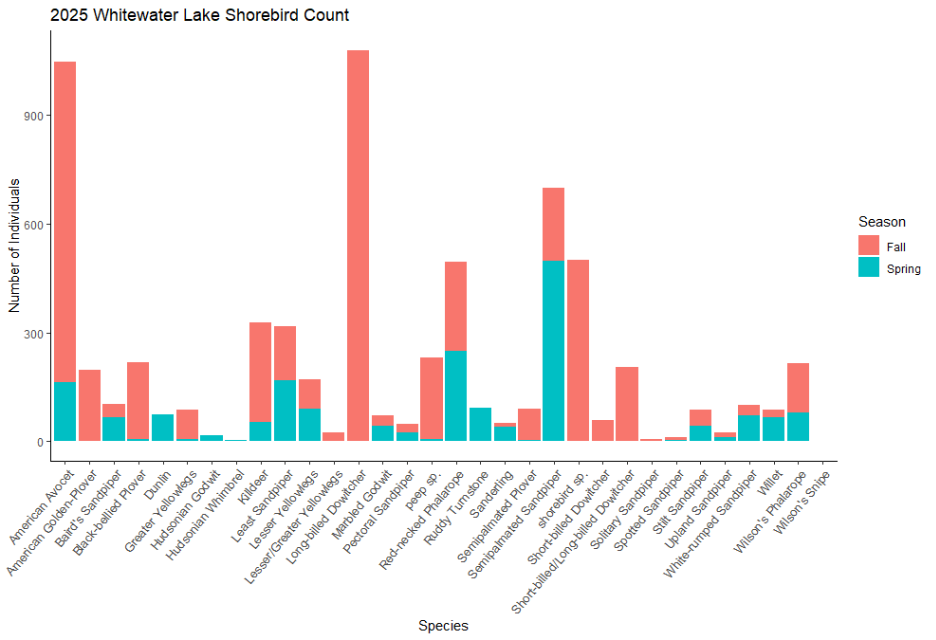
Whitewater Lake had the highest numbers of shorebirds reported, as well as the highest species richness. In the spring, the most abundant species was the Semipalmated Sandpiper, while in the fall there were large numbers of Long-billed Dowitchers and American Avocets. These numbers are based on 39 eBird checklists in the spring, and 35 checklists in the fall, for a total of 74 checklists. Huge thank you to all who shared their Whitewater Lake eBird checklists with us, including Gillian, Colin, Sandy, Emily, Matthew, Carson, Glennis, Gene, John, Bonnie, Greg, Gwen, Amy, Kristopher, Renee, Megan, Pranav, Garry, Rudolf, Anita, Bill, Jackie, Mike, Cameron, and Tim.
| Species | Fall Count | Spring Count | Total |
| American Avocet | 885 | 164 | 1049 |
| American Golden-Plover | 198 | 0 | 198 |
| Baird’s Sandpiper | 38 | 66 | 104 |
| Black-bellied Plover | 212 | 5 | 217 |
| Dunlin | 0 | 75 | 75 |
| Greater Yellowlegs | 81 | 6 | 87 |
| Hudsonian Godwit | 1 | 16 | 17 |
| Hudsonian Whimbrel | 0 | 4 | 4 |
| Killdeer | 276 | 52 | 328 |
| Least Sandpiper | 151 | 167 | 318 |
| Lesser Yellowlegs | 80 | 90 | 170 |
| Lesser/Greater Yellowlegs | 25 | 0 | 25 |
| Long-billed Dowitcher | 1080 | 0 | 1080 |
| Marbled Godwit | 29 | 43 | 72 |
| Pectoral Sandpiper | 22 | 25 | 47 |
| peep sp. | 225 | 7 | 232 |
| Red-necked Phalarope | 246 | 250 | 496 |
| Ruddy Turnstone | 0 | 92 | 92 |
| Sanderling | 11 | 40 | 51 |
| Semipalmated Plover | 86 | 4 | 90 |
| Semipalmated Sandpiper | 203 | 498 | 701 |
| shorebird sp. | 500 | 0 | 500 |
| Short-billed Dowitcher | 58 | 1 | 59 |
| Short-billed/Long-billed Dowitcher | 205 | 0 | 205 |
| Solitary Sandpiper | 5 | 0 | 5 |
| Spotted Sandpiper | 8 | 2 | 10 |
| Stilt Sandpiper | 44 | 43 | 87 |
| Upland Sandpiper | 13 | 12 | 25 |
| White-rumped Sandpiper | 28 | 71 | 99 |
| Willet | 23 | 65 | 88 |
| Wilson’s Phalarope | 135 | 80 | 215 |
| Wilson’s Snipe | 0 | 1 | 1 |
| Number of Species | 28 | 26 | 32 |
| Grand Total | 4868 | 1879 | 6747 |
Shoal Lakes
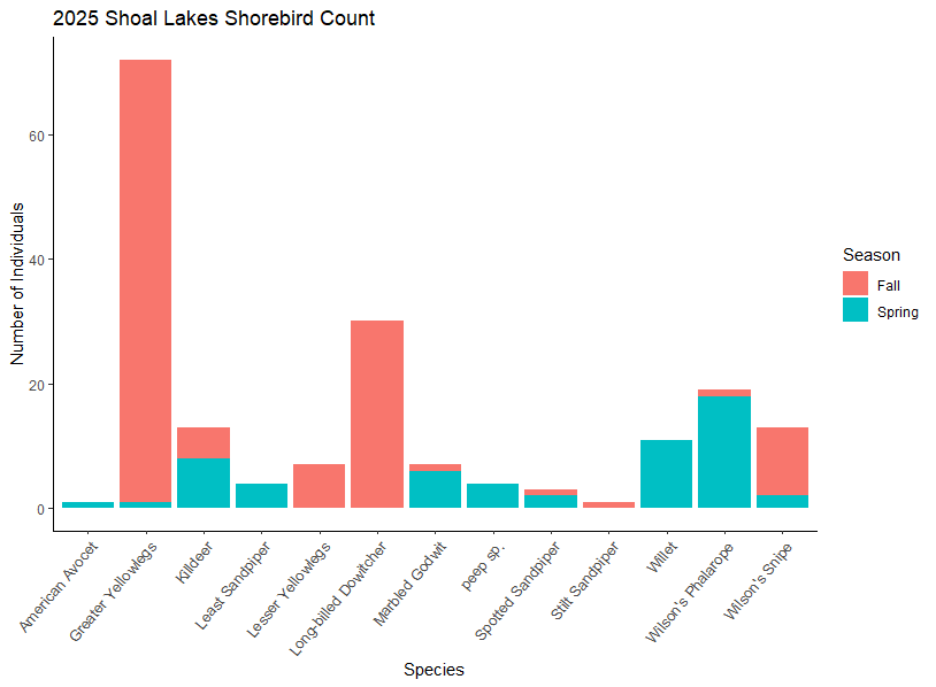
The North, West and East Shoal Lakes hosted 13 species of shorebirds over the spring and fall seasons, with 10 in the spring and 9 in the fall. Dominant species at the Shoal Lakes included Wilson’s Phalarope and Willets in the spring, and Greater Yellowlegs in the fall. These counts were based on 11 spring checklists, and 13 fall checklists, for a total of 24 checklists. Thanks to John, Tim, Walfried, Cam, Chris, Bonnie, Gwen, Peter, Paul, Betsy, Jan, Jo, Garry, Gene, Rudolf, and Robert for sharing your eBird checklists with us!
| Species | Fall Count | Spring Count | Total |
| American Avocet | 0 | 1 | 1 |
| Greater Yellowlegs | 71 | 1 | 72 |
| Killdeer | 5 | 8 | 13 |
| Least Sandpiper | 0 | 4 | 4 |
| Lesser Yellowlegs | 7 | 0 | 7 |
| Long-billed Dowitcher | 30 | 0 | 30 |
| Marbled Godwit | 1 | 6 | 7 |
| peep sp. | 0 | 4 | 4 |
| Spotted Sandpiper | 1 | 2 | 3 |
| Stilt Sandpiper | 1 | 0 | 1 |
| Willet | 0 | 11 | 11 |
| Wilson’s Phalarope | 1 | 18 | 19 |
| Wilson’s Snipe | 11 | 2 | 13 |
| Number of Species | 9 | 10 | 13 |
| Grand Total | 128 | 57 | 185 |
Oak Lake/Plum Lakes
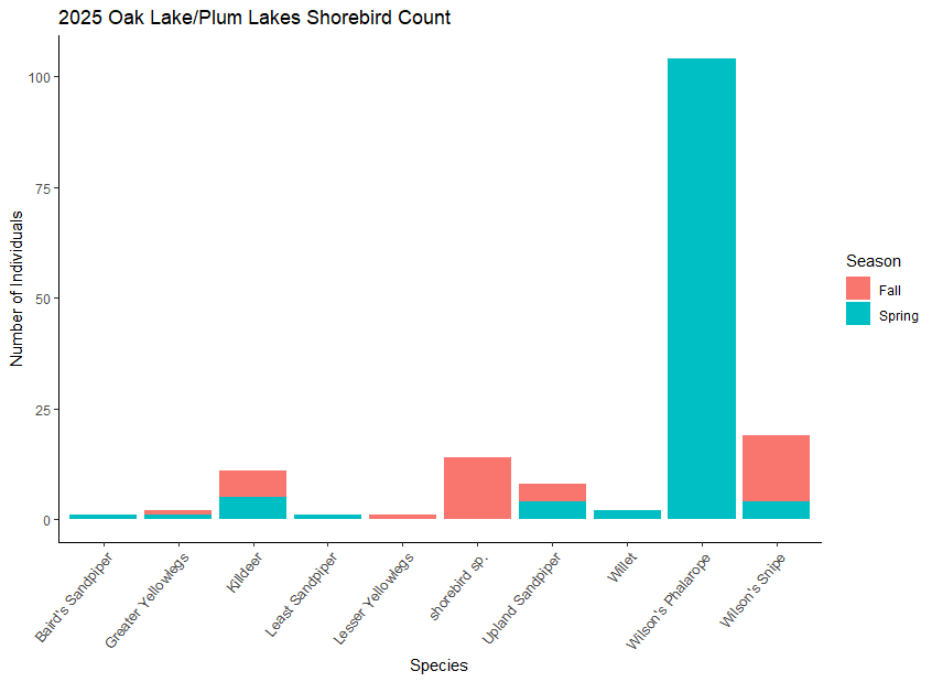
The Oak Lake/Plum Lakes IBA had the lowest species richness of the four target sites, and relatively low species counts in both the spring and fall. The one outlier was the large numbers of Wilson’s Phalaropes observed in the spring. These numbers are based on 9 spring checklists, and 5 fall checklists, for a total of 14 checklists. Thank you to Matthew, Bonnie, Greg, Gwen, Glennis, Sandy, Gene, John, Simone, Anita, Bill, Gillian, Jackie, and Mike for sharing your observations with us!
| Species | Fall Count | Spring Count | Total |
| Baird’s Sandpiper | 0 | 1 | 1 |
| Greater Yellowlegs | 1 | 1 | 2 |
| Killdeer | 6 | 5 | 11 |
| Least Sandpiper | 0 | 1 | 1 |
| Lesser Yellowlegs | 1 | 0 | 1 |
| shorebird sp. | 14 | 0 | 14 |
| Upland Sandpiper | 4 | 4 | 8 |
| Willet | 0 | 2 | 2 |
| Wilson’s Phalarope | 0 | 104 | 104 |
| Wilson’s Snipe | 15 | 4 | 19 |
| Number of Species | 6 | 8 | 10 |
| Grand Total | 41 | 122 | 163 |
Oak Hammock Marsh
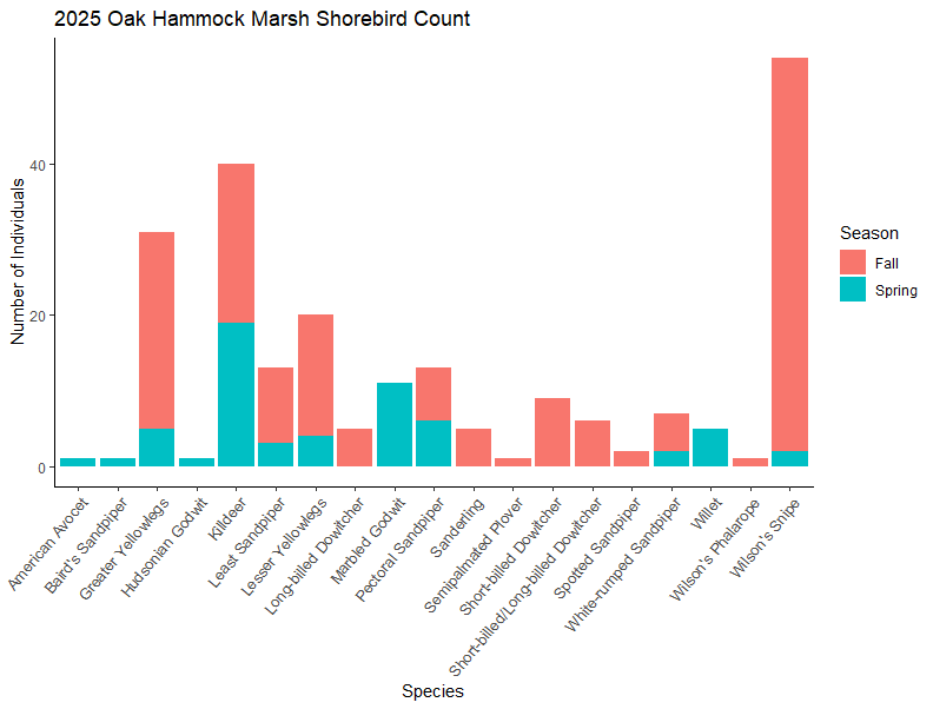
Our final target site was Oak Hammock Marsh, which had a higher overall species richness than Oak Lake/Plum Lakes and the Shoal Lakes, although not as high as Whitewater Lake. The most abundant spring species were Killdeer and Marbled Godwit, and the most abundant fall species was Wilson’s Snipe. These numbers are based on 10 surveys in each of the spring and fall seasons. Thank you to Bonnie, Gwen, Garry, Aynsley, John, Tami, Emily, Graham, Matthew, Joanne, Paul, Betsy, Jan, Jo, Katharine, Tim and Linnea for sharing your checklists with us!
| Species | Fall Count | Spring Count | Total |
| American Avocet | 0 | 1 | 1 |
| Baird’s Sandpiper | 0 | 1 | 1 |
| Greater Yellowlegs | 26 | 5 | 31 |
| Hudsonian Godwit | 0 | 1 | 1 |
| Killdeer | 21 | 19 | 40 |
| Least Sandpiper | 10 | 3 | 13 |
| Lesser Yellowlegs | 16 | 4 | 20 |
| Long-billed Dowitcher | 5 | 0 | 5 |
| Marbled Godwit | 0 | 11 | 11 |
| Pectoral Sandpiper | 7 | 6 | 13 |
| Sanderling | 5 | 0 | 5 |
| Semipalmated Plover | 1 | 0 | 1 |
| Short-billed Dowitcher | 9 | 0 | 9 |
| Short-billed/Long-billed Dowitcher | 6 | 0 | 6 |
| Spotted Sandpiper | 2 | 0 | 2 |
| White-rumped Sandpiper | 5 | 2 | 7 |
| Willet | 0 | 5 | 5 |
| Wilson’s Phalarope | 1 | 0 | 1 |
| Wilson’s Snipe | 52 | 2 | 54 |
| Number of Species | 14 | 12 | 19 |
| Grand Total | 166 | 60 | 226 |
Other Important Sites
This is where we’re going to stray a little bit from the usual format of these roundup posts. This year we asked for all of your shorebird observations, outside of the ISS routes, and even outside of IBA boundaries. Similar to the data above, I only used the observations from April 1 – June 15 for spring observations and July 11 – October 25 for fall. There were shorebird observations in the period between these two ranges, but to stay consistent with the figures above, we’re going to exclude that data for now.
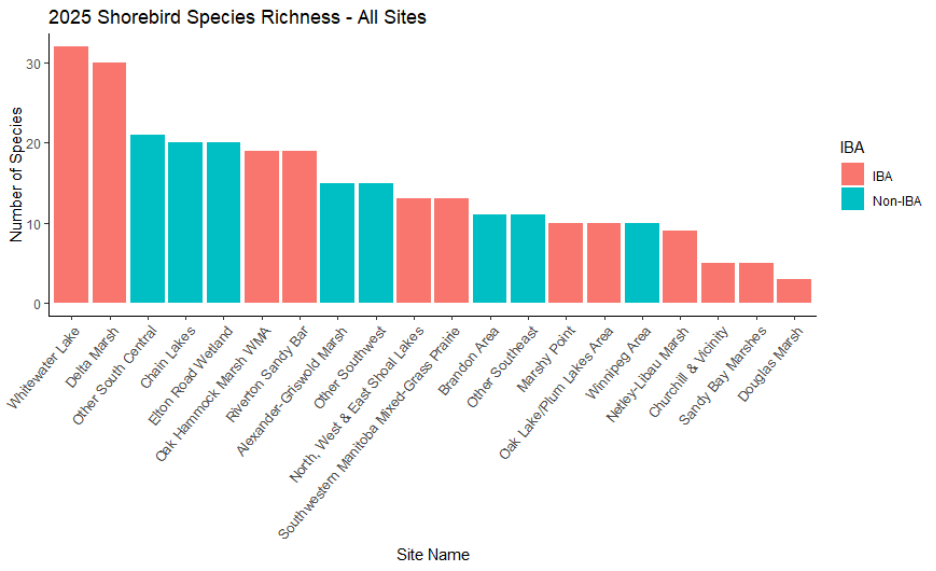
The figures below take into account all of the shorebird observations that were shared with us on eBird for the fall and spring seasons. Areas outside of IBA’s that were obvious groups, such as the Chain Lakes, Elton Road Wetland, and the Alexander-Griswold Marsh complex, were grouped together. Other observations were grouped by geographic areas into “Other Southwest”, “Other South Central”, and “Other Southeast”.
In terms of species richness, the site with the highest number of species overall was Whitewater Lake, followed closely by Delta Marsh. Interestingly, the next three highest values were not found in IBA’s, but in the “Other South Central” category (which includes the Pilot Mound area, and the southern Interlake), the Chain Lakes, and the Elton Road Wetland.
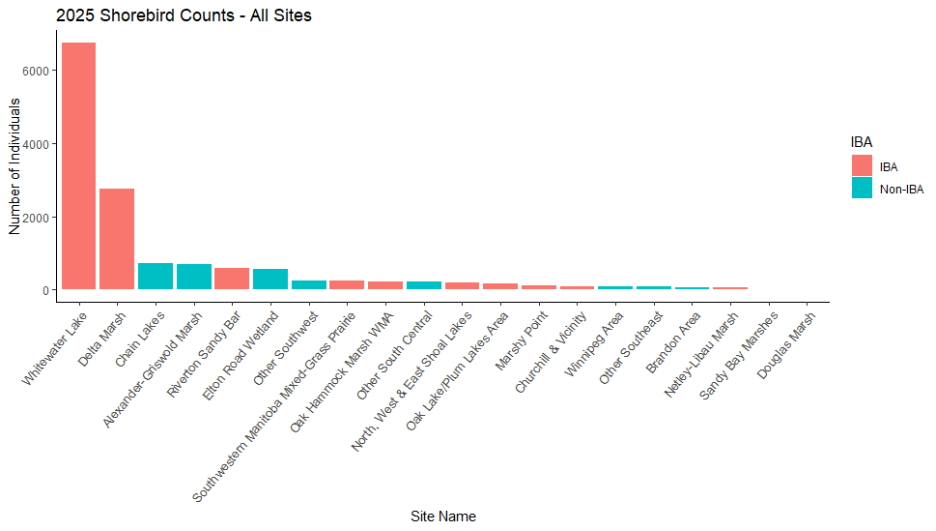
We see similar results looking at the overall shorebird counts for 2025. The site with the highest count by far was Whitewater Lake, followed again by Delta Marsh. The next highest were the Chain Lakes and the Alexander-Griswold Marsh areas.
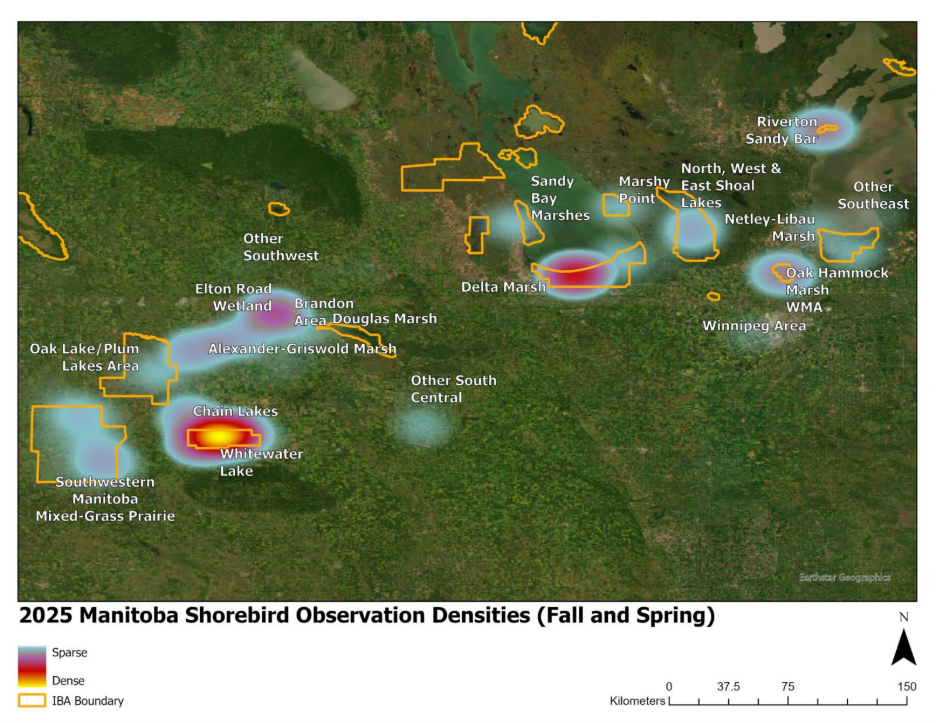
The map below takes this data one step further, showing the density of observations as a heat map. Yellow and red areas are those with high numbers of observations, while the lighter blue areas only have a few observations. We can see from the map that the Southwest had the highest density of points, concentrated around the Whitewater Lake IBA, the Southwestern Manitoba Mixed-Grass Prairie IBA and the wetlands surrounding Brandon. The other region that stands out on the map is Delta Marsh IBA.
Overall, we can say that southern Manitoba has many different areas that host shorebirds throughout their spring and fall migrations, both within and outside of IBA boundaries. Once again, a huge thank you to everyone who shared their eBird checklists with us, we wouldn’t be able to do this work without our incredibly talented network of volunteer citizen scientists!! If you’re interested in participating in our shorebird surveys, send us an email at iba@naturemanitoba.ca!
-Mackenzie
